Dear all,
I am tring to overplot an HEK feature (coronal holes boundaries) on AIA/SDO maps (1930 nm channel), following the sunpy gallery example (here the link Overplotting HEK feature/event polygons on a map — SunPy 4.1.3 documentation). I have noticed that there is a sistematic shift between the CH on the AIA map and the poligon as obtained by HEK by using the Spoca algorithm. It seems that the problem is in the way in which the code associates the time to the CH boundary as obtained from HEK: the code assumes that the time that we need to associate to the polygon of the CH is ‘event_starttime’. Tring to substitue this time with the keyword ‘event_endtime’ it seems to work.
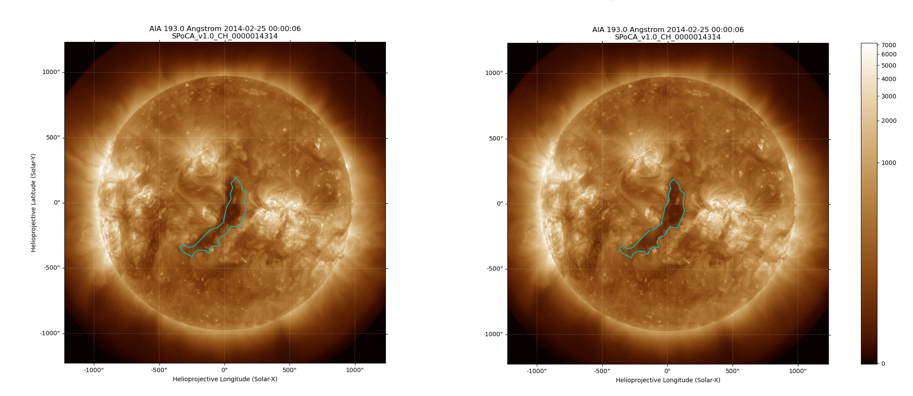
I report below an example, where I extracted the CH boundary in an AIA map (in this case I used level 1 filtergrams but the problem persists also with level 1.5) using the code in the link imposing in a case that " ch_date=parse_time(ch[‘event_starttime’])" (imagein on left) as reported in the code in the gallery, and in a case that " ch_date=parse_time(ch[‘event_endtime’])" (image on the right). You can clearly see that in the second case there is no shift.
I have noticed that the same happens with JHelioviewer: when I select an AIA filetrgram layer and I use Spoca to draw CH boundaries they seem to be shifted with respect to the CH.
Now my question is: am I doing something wrong? What is the difference between the keywords “event_endtime” and “event_starttime”? Sorry for the long message
Matteo
Hello Matteo313,
Could we get a copy of the code used to create that figure?
It would make investigations on our side a bit easier.
Can you also tell us what the start time and end time values are?
With regards to the problem as it stands, it is quite tricky to know. Since as you say this happens in JHelioviewer. The data comes from HEK, so if there is a problem with the start time, there isn’t much to be done from the sunpy side.
What is the difference between the keywords “event_endtime” and “event_starttime”?
The best source for this information is the HEK definitions: https://www.lmsal.com/hek/VOEvent_Spec.html
Cheers,
Nabil
Hi nabobalis and thank you for the answer.
The code is:
import matplotlib.pyplot as plt
import numpy as np
import astropy.units as u
from astropy.coordinates import SkyCoord
from astropy.time import TimeDelta
import sunpy.map
from sunpy.coordinates import frames
from sunpy.net import attrs as a
from sunpy.net import hek
from sunpy.physics.differential_rotation import solar_rotate_coordinate
from sunpy.time import parse_time
aia_map = sunpy.map.Map(‘aia.lev1_euv_12s.2014-02-25T000008Z.193.image_lev1.fits’)
hek_client = hek.HEKClient()
start_time = aia_map.date - TimeDelta(2u.hour)
end_time = aia_map.date + TimeDelta(2u.hour)
responses = hek_client.search(a.Time(start_time, end_time), a.hek.CH, a.hek.FRM.Name == ‘SPoCA’)
area = 0.0
for i, response in enumerate(responses):
if response[‘area_atdiskcenter’] > area and np.abs(response[‘hgc_y’]) < 30.0:
area = response[‘area_atdiskcenter’]
response_index = i
ch = responses[response_index] #selected event from HEK
p1 = ch[“hpc_boundcc”][9:-2]
p2 = p1.split(‘,’)
p3 = [v.split(" ") for v in p2]
#ch_date1: I assume that the date and the time of the CH boundary is “event_starttime” (as done in the example of the gallery)
ch_date1 = parse_time(ch[‘event_starttime’]) # starttime of the selected event (from HEK)
#ch_date2: I assume that the date and time of the CH boundary is “event_endtime”
ch_date2 = parse_time(ch[‘event_endtime’]) # endtime of the selected event (from HEK)
ch_boundary1 = SkyCoord(
[(float(v[0]), float(v[1])) * u.arcsec for v in p3],
obstime=ch_date1, observer=“earth”,
frame=frames.Helioprojective)
ch_boundary2 = SkyCoord(
[(float(v[0]), float(v[1])) * u.arcsec for v in p3],
obstime=ch_date2, observer=“earth”,
frame=frames.Helioprojective)
rotated_ch_boundary1 = solar_rotate_coordinate(ch_boundary1, time=aia_map.date)
rotated_ch_boundary2 = solar_rotate_coordinate(ch_boundary2, time=aia_map.date)
fig = plt.figure(figsize=(12, 5))
ax1 = fig.add_subplot(121, projection=aia_map)
ax2 = fig.add_subplot(122, projection=aia_map)
aia_map.plot(axes=ax1, clip_interval=(1, 99.9)*u.percent)
ax1.plot_coord(rotated_ch_boundary1, color=‘c’)
ax1.set_title(‘{:s}\n{:s}’.format(aia_map.name, ch[‘frm_specificid’]))
aia_map.plot(axes=ax2, clip_interval=(1, 99.9)*u.percent)
ax2.plot_coord(rotated_ch_boundary2, color=‘c’)
ax2.set_title(‘{:s}\n{:s}’.format(aia_map.name, ch[‘frm_specificid’]))
########################################################
The start_time that I use for the HEK search is Time object: scale=<‘utc’ format=‘isot’ value=2014-02-24T22:00:06.838.>
The end_time that I use for the HEK search is Time object: <scale=‘utc’ format=‘isot’ value=2014-02-25T02:00:06.838.> (basically +/2 hours with respect the aia_map.time)
While for the selected HEK event, from the HEK database I obtain:
ch[‘event_starttime’]=<Time object: scale=‘utc’ format=‘iso’ value=2014-02-24 23:16:55.000>
ch[‘event_endtime’]=<Time object: scale=‘utc’ format=‘iso’ value=2014-02-25 03:17:07.000>
Thank you,
Matteo
Thanks for the code.
I suspect is that the boundary is defined for the end time of the coronal hole.
This means that when you transform the points with solar_rotate_coordinate, when you use start time the points are not actually at that location. Thus causing the misalignment.
But when you use end time it works because the boundary points are actually located there at that time. So using solar_rotate_coordinate works correctly.