Alignment issue

basically my aim is to make movie, first I’m making image then merge them, so for making image i want to stop differential rotation of SUN, so that all the images are aligned as if the Sun stopped rotating at the time of the first image. So the solar features should stay in the same position. this is my main objective, i tried like this

import os
import glob
import matplotlib
import sunpy.map
import numpy as np
import astropy.units as u
import matplotlib.pyplot as plt
from matplotlib.colors import LogNorm
from astropy.coordinates import SkyCoord
from sunpy.coordinates import SphericalScreen, propagate_with_solar_surface
from astropy.visualization import AsinhStretch
from astropy.visualization.mpl_normalize import ImageNormalize

matplotlib.rcParams.update({'font.size': 14.5, 'font.weight': 'bold'})

data_dir = ''

files304 = sorted(glob.glob(os.path.join(data_dir, 'aia.lev1_euv_12s.*.304.image.fits')))

if not files304:
    print(f"No .fits files found in: {data_dir}")
    exit()

first_file = files304[0]
ref_map = sunpy.map.Map(first_file)
ref_map_timestamp = ref_map.date 

bottom_left_submap_coords = SkyCoord(700 * u.arcsec, -300 * u.arcsec, frame=ref_map.coordinate_frame)
top_right_submap_coords = SkyCoord(1190 * u.arcsec, 200 * u.arcsec, frame=ref_map.coordinate_frame)

with SphericalScreen(ref_map.observer_coordinate):
    ref_submap = ref_map.submap(bottom_left=bottom_left_submap_coords, top_right=top_right_submap_coords)

ref_submap_wcs = ref_submap.wcs

for idx, file304 in enumerate(files304):
    print(f"Processing file {idx+1}/{len(files304)}: {os.path.basename(file304)}")
    cur_map = sunpy.map.Map(file304) 
       
    try:
        with propagate_with_solar_surface():
            with SphericalScreen(cur_map.observer_coordinate):
                aia_map_304_reprojected = cur_map.reproject_to(ref_submap_wcs)
    except Exception as e:
        continue
    
    aia_map_304_reprojected.data[aia_map_304_reprojected.data <= 0] = 1e-6

    data_for_percentile = aia_map_304_reprojected.data[~np.isnan(aia_map_304_reprojected.data)]

    if len(data_for_percentile) > 0:
        max_val_clip = np.percentile(data_for_percentile[data_for_percentile > 0], 99.5)
        aia_map_304_reprojected.data[aia_map_304_reprojected.data > max_val_clip] = max_val_clip

        vmin = np.percentile(data_for_percentile[data_for_percentile > 0], 0.2)
        vmax = np.percentile(data_for_percentile[data_for_percentile > 0], 99)
    else:
        vmin = 1e-6
        vmax = 1

    timestamp_original = cur_map.date.strftime("%Y-%m-%d %H:%M:%S")

    fig = plt.figure(figsize=(10, 10))
    ax = fig.add_subplot(1, 1, 1, projection=aia_map_304_reprojected)

    aia_map_304_reprojected.plot(axes=ax, norm=LogNorm(vmin=vmin, vmax=vmax))

    ax.set_title(None)
    ax.text(0.05, 0.95, f"{timestamp_original}", transform=ax.transAxes, color='white',
            bbox=dict(facecolor='black', alpha=0.5, edgecolor='none', pad=2)) 
    ax.grid(False) 
    ax.tick_params(axis='both', direction='in', width=2, length=6, weight='bold')

    ax.coords[0].set_axislabel('Solar-X [arcsec]')
    ax.coords[1].set_axislabel('Solar-Y [arcsec]')

    plt.tight_layout()

    save_filename = f"aligned_diffrot_aia_frame_304_{idx:03d}.jpg"
    plt.savefig(save_filename, dpi=300, bbox_inches='tight')

    plt.close(fig)

Hi, I’ve moved your post to the SunPy section and edited it’s markdown syntax. Please have a look at Extended Syntax | Markdown Guide to know how to format code blocks both here and in the chat.

1 Like

Ok here a minimal example of how to do what you are trying to I think the key thing is the keywords to the context mangers

import astropy.units as u
import matplotlib.pyplot as plt
import matplotlib.animation as animation

from astropy.coordinates import SkyCoord
from sunpy.coordinates import SphericalScreen, propagate_with_solar_surface
from sunpy.map import Map, MapSequence

urls = [f'https://solmon.dias.ie/data/2025/07/15/AIA/fits/aia20250715_{i:02d}0000_0171.fits' for i in range(24)]

ref_map = Map(urls[0])

bottom_left = SkyCoord(700 * u.arcsec, -300 * u.arcsec, frame=ref_map.coordinate_frame)
top_right = SkyCoord(1190 * u.arcsec, 200 * u.arcsec, frame=ref_map.coordinate_frame)
ref_submap = ref_map.submap(bottom_left=bottom_left, top_right=top_right)

out_maps = [ref_submap]

for i in range(1, 23):
    with propagate_with_solar_surface(), SphericalScreen(ref_submap.observer_coordinate, only_off_disk=True):
        try:
            cur_map = Map(urls[i])
            repro_map = cur_map.reproject_to(ref_submap.wcs)
            out_maps.append(repro_map)
        except:
            print(i, urls[i])

ms = MapSequence(out_maps)


fig = plt.figure()
ax = fig.add_subplot(111, projection=ref_submap)

ani = ms.plot(axes=ax)

encoder =  animation.writers['ffmpeg']
writer = encoder(fps=2, bitrate=1800)

ani.save('diff_rot.mp4', writer=writer)

SphericalScreen(ref_submap.observer_coordinate) will project the entire map onto a screen and the differential rotation correction won’t behave as you may expect but SphericalScreen(ref_submap.observer_coordinate, only_off_disk=True) means only the off disk part of the map is projected on a spherical screen and the on disk part is corrected as expected.

2 Likes

Hello, Now i am applying same concept of re-projection is in my time-distance script, i am doing like that, i plot two panels together, in first panel i make a plot from data, that panel appears with aligned data perfectly, then i clicked 16 time along eruption and take slit, that slit’s length now is in second panel’s y axes, and the whole data time in in x axes, earlier without alignment it works perfectly, when i deal with alignment, first panel appear, but in second panel only first data file taking in second panel’s x axes. please help me, here i am attaching both output files also,


import os
import gc
import uuid
import glob
import matplotlib
import sunpy.map
import numpy as np
from tqdm import tqdm
import astropy.units as u
from astropy.wcs import WCS
from astropy.time import Time
import matplotlib.pyplot as plt
from matplotlib.colors import LogNorm
from scipy.ndimage import uniform_filter
from astropy.coordinates import SkyCoord
from datetime import datetime, timedelta
from scipy.interpolate import RegularGridInterpolator
import sunpy.visualization.colormaps.cm as sunpy_cm
from matplotlib.ticker import FuncFormatter, FixedLocator, AutoMinorLocator
from sunpy.coordinates import SphericalScreen, Helioprojective, propagate_with_solar_surface
from scipy.optimize import curve_fit
import matplotlib.patheffects as pe

matplotlib.use('TkAgg')
matplotlib.rcParams.update({'font.size': 18, 'font.weight': 'bold'})

data_dir = '/home/JSOC_20250404_004534'

wavelength = 304
chunk_size = 100
npz_file = f'aia{wavelength}_maps.npz'

timestamp = datetime.now().strftime("%Y%m%d_%H%M%S")
output_npz_file = f'aia{wavelength}_timeslice_{timestamp}_{uuid.uuid4().hex[:8]}.npz'

click_counter = {'count': 0}

files = sorted(glob.glob(os.path.join(data_dir, f'aia.lev1_euv_12s.*.{wavelength}.image.fits')))

if len(files) <= 182:
    raise IndexError(f"File index 182 out of bounds. Only {len(files)} images found.")
print(f"Number of images: {len(files)}")

cmap = getattr(sunpy_cm, f'sdoaia{wavelength}')

regenerate_npz = False
if os.path.exists(npz_file):
    try:
        with np.load(npz_file, allow_pickle=True) as data:
            if 'map_times' not in data or 'map_3d' not in data or 'map_wcs' not in data:
                print("Warning: 'map_times', 'map_3d', or 'map_wcs' missing in npz file. Regenerating.")
                regenerate_npz = True
            else:
                if len(data['map_wcs']) > 0 and isinstance(data['map_wcs'][0], str):
                    print("Warning: 'map_wcs' in npz file is in old string format. Regenerating.")
                    regenerate_npz = True
    except Exception as e:
        print(f"Error reading npz file: {e}. Regenerating.")
        regenerate_npz = True
else:
    regenerate_npz = True

if regenerate_npz:
    print("Regenerating NPZ file from FITS data...")
    ref_map = sunpy.map.Map(files[0])
    ref_observer = ref_map.observer_coordinate
    if ref_observer is None:
        raise ValueError("Reference map observer coordinate missing.")
    ref_hpc_frame = Helioprojective(obstime=ref_map.date, observer=ref_observer)

    with SphericalScreen(ref_observer):
        ref_map = ref_map.submap(
            SkyCoord(700 * u.arcsec, -300 * u.arcsec, frame=ref_hpc_frame),
            top_right=SkyCoord(1190 * u.arcsec, 200 * u.arcsec, frame=ref_hpc_frame))
    ref_shape = np.array(ref_map.data.shape) * u.pix
    ref_wcs = ref_map.wcs

    all_maps = []
    for i in tqdm(range(0, len(files), chunk_size)):
        chunk_files = files[i:i + chunk_size]
        for file in chunk_files:
            try:
                smap = sunpy.map.Map(file)
                smap_hpc_frame = Helioprojective(obstime=smap.date, observer=smap.observer_coordinate)
                with SphericalScreen(smap.observer_coordinate), propagate_with_solar_surface():
                    smap_sub = smap.submap(
                        SkyCoord(700 * u.arcsec, -300 * u.arcsec, frame=smap_hpc_frame),
                        top_right=SkyCoord(1190 * u.arcsec, 200 * u.arcsec, frame=smap_hpc_frame))
                    repro_map = smap_sub.reproject_to(ref_wcs)
                    repro_map = repro_map.resample(ref_shape, method='linear')

                    data = repro_map.data.copy().astype(np.float32)
                    data[np.isnan(data)] = [repro_map]
                    data[data <= 0] = 1e-6
                    max_val = np.percentile(data[data > 0], 99.5)
                    data[data > max_val] = max_val

                    print(f"File {file}: Reprojected map data min={np.nanmin(data)}, max={np.nanmax(data)}, NaN count={np.sum(np.isnan(data))}")

                    cleaned_map = sunpy.map.Map(data, repro_map.meta)
                    all_maps.append(cleaned_map)

            except Exception as e:
                print(f"Error processing file {file}: {e}")
                continue

    map_3d_arr = np.array([m.data for m in all_maps])
    map_wcs_headers_dict = np.array([dict(m.wcs.to_header()) for m in all_maps], dtype=object)
    map_times_dt = np.array([m.date.datetime for m in all_maps])

    np.savez_compressed(npz_file, map_3d=map_3d_arr, map_wcs=map_wcs_headers_dict, map_times=map_times_dt)

    del map_3d_arr, map_wcs_headers_dict, map_times_dt
    gc.collect()

else:
    print(f"Loading data from existing {npz_file}...")
    data = np.load(npz_file, allow_pickle=True, mmap_mode='r')
    loaded_map_3d = data['map_3d']
    loaded_map_wcs_headers = data['map_wcs']

    try:
        loaded_map_times_dt = data['map_times']
    except KeyError:
        print("Warning: 'map_times' not found in npz file. Generating times with 12-second cadence.")
        loaded_map_times_dt = np.array([datetime(2014, 2, 19, 9, 45, 6) + timedelta(seconds=12 * i) for i in range(len(loaded_map_3d))])

    all_maps = []
    for i in range(len(loaded_map_3d)):
        try:
            current_wcs = WCS(loaded_map_wcs_headers[i])
            current_map = sunpy.map.Map(loaded_map_3d[i], current_wcs.to_header())
            current_map.meta['date_obs'] = loaded_map_times_dt[i].isoformat()
            all_maps.append(current_map)
        except Exception as e:
            print(f"Error reconstructing map {i} from NPZ: {e}")
            continue
    del loaded_map_3d, loaded_map_wcs_headers, loaded_map_times_dt
    gc.collect()

if len(all_maps) > 0:
    print(f"First frame time: {all_maps[0].date.strftime('%Y-%m-%d %H:%M:%S')}")
    print(f"Last frame time: {all_maps[-1].date.strftime('%Y-%m-%d %H:%M:%S')}")

def calculate_cumulative_distances(points, smap):
    if len(points) < 2:
        print("Error: Insufficient points for distance calculation.")
        return np.array([])

    world_coords = smap.pixel_to_world(np.array(points)[:, 0] * u.pixel, np.array(points)[:, 1] * u.pixel)
    x_arcsec = world_coords.Tx.to(u.arcsec).value
    y_arcsec = world_coords.Ty.to(u.arcsec).value

    segment_lengths = np.sqrt(np.diff(x_arcsec)**2 + np.diff(y_arcsec)**2)
    cumulative_distances = np.concatenate(([0], np.cumsum(segment_lengths)))
    
    return cumulative_distances

def interpolate_along_path(smap, path_x_pixels, path_y_pixels):
    data = smap.data
    ny, nx = data.shape

    path_x_pixels_clamped = np.clip(path_x_pixels, 0, nx - 1)
    path_y_pixels_clamped = np.clip(path_y_pixels, 0, ny - 1)

    interpolated_values = RegularGridInterpolator(
        (np.arange(ny), np.arange(nx)), data, method='linear', bounds_error=False, fill_value=0
    )((path_y_pixels_clamped, path_x_pixels_clamped))

    if np.all(interpolated_values == 0):
        print("Warning: All interpolated values are zero. Check slit path or map data.")
    
    return interpolated_values

def generate_time_distance_data(maps, cut_points_pixel, slit_width_arcsec=None, boxcar_filter_size=None):
    if not maps or len(cut_points_pixel) < 2:
        print("Error: No maps or insufficient cut points for time-distance data.")
        return np.array([]), np.array([]), []

    first_map = maps[0]
    wcs = first_map.wcs

    x_pixels = np.array([p[0] for p in cut_points_pixel])
    y_pixels = np.array([p[1] for p in cut_points_pixel])

    segment_lengths_pix = np.sqrt(np.diff(x_pixels)**2 + np.diff(y_pixels)**2)
    total_length_pix = np.sum(segment_lengths_pix)
    num_points_interp = int(total_length_pix * 2) + 1

    t = np.linspace(0, 1, num_points_interp)
    dense_x_pix = np.zeros(num_points_interp)
    dense_y_pix = np.zeros(num_points_interp)

    cumulative_lengths_pix = np.concatenate(([0], np.cumsum(segment_lengths_pix)))
    normalized_lengths = cumulative_lengths_pix / cumulative_lengths_pix[-1]

    for i in range(len(t)):
        t_val = t[i]
        segment_idx = np.searchsorted(normalized_lengths, t_val, side='right') - 1
        segment_idx = min(segment_idx, len(cut_points_pixel) - 2)
        
        t_segment = (t_val - normalized_lengths[segment_idx]) / (normalized_lengths[segment_idx + 1] - normalized_lengths[segment_idx]) if normalized_lengths[segment_idx + 1] != normalized_lengths[segment_idx] else 0
        
        dense_x_pix[i] = x_pixels[segment_idx] + t_segment * (x_pixels[segment_idx + 1] - x_pixels[segment_idx])
        dense_y_pix[i] = y_pixels[segment_idx] + t_segment * (y_pixels[segment_idx + 1] - x_pixels[segment_idx])

    path_points_for_dist = list(zip(dense_x_pix, dense_y_pix))
    cumulative_distances = calculate_cumulative_distances(path_points_for_dist, first_map)

    num_spatial_points = len(dense_x_pix)
    map_times = [m.date.datetime for m in maps]
    stackplot_data = np.zeros((num_spatial_points, len(maps)))

    pixel_scale_x = np.abs(wcs.pixel_to_world(1*u.pixel,0*u.pixel).Tx.value - wcs.pixel_to_world(0*u.pixel,0*u.pixel).Tx.value)
    pixel_scale_y = np.abs(wcs.pixel_to_world(0*u.pixel,1*u.pixel).Ty.value - wcs.pixel_to_world(0*u.pixel,0*u.pixel).Ty.value)
    avg_pixel_scale = (pixel_scale_x + pixel_scale_y) / 2.0

    current_slit_pixels = 0
    if slit_width_arcsec is not None:
        current_slit_pixels = int(np.round(slit_width_arcsec / avg_pixel_scale))

    dx = np.diff(dense_x_pix)
    dy = np.diff(dense_y_pix)
    segment_lengths = np.sqrt(dx**2 + dy**2)
    segment_lengths = np.concatenate(([segment_lengths[0]], segment_lengths))
    unit_tx = np.zeros_like(dense_x_pix)
    unit_ty = np.zeros_like(dense_y_pix)
    unit_px = np.zeros_like(dense_x_pix)
    unit_py = np.zeros_like(dense_y_pix)

    for i in range(len(dense_x_pix)):
        if i == 0:
            tx = dx[0]
            ty = dy[0]
        elif i == len(dense_x_pix) - 1:
            tx = dx[-1]
            ty = dy[-1]
        else:
            tx = (dx[i-1] + dx[i]) / 2
            ty = (dy[i-1] + dy[i]) / 2
        length = np.sqrt(tx**2 + ty**2)
        if length > 0:
            unit_tx[i] = tx / length
            unit_ty[i] = ty / length
            unit_px[i] = unit_ty[i]
            unit_py[i] = -unit_tx[i]
        else:
            unit_tx[i] = unit_ty[i] = unit_px[i] = unit_py[i] = 0

    for i, smap in enumerate(maps):
        map_data = smap.data.copy()

        if boxcar_filter_size is not None and boxcar_filter_size > 1:
            map_data = uniform_filter(map_data, size=boxcar_filter_size, mode='constant')

        temp_map = sunpy.map.Map(map_data, smap.meta)

        slit_intensities_per_map = []

        for k_offset in range(-current_slit_pixels, current_slit_pixels + 1):
            slit_line_x_pixels = dense_x_pix + k_offset * unit_px
            slit_line_y_pixels = dense_y_pix + k_offset * unit_py

            interpolated_values = interpolate_along_path(temp_map, slit_line_x_pixels, slit_line_y_pixels)
            slit_intensities_per_map.append(interpolated_values)

        stackplot_data[:, i] = np.nanmean(np.array(slit_intensities_per_map), axis=0)

    if np.all(stackplot_data == 0):
        print("Warning: Stackplot data is all zeros. Check if slit path lies in valid data region.")
    elif np.any(np.isnan(stackplot_data)):
        print(f"Warning: Stackplot data contains {np.sum(np.isnan(stackplot_data))} NaN values.")

    return stackplot_data, cumulative_distances, map_times

def linear_function(x, m, c):
    return m * x + c

if len(files) > 182:
    aia_map_initial = sunpy.map.Map(files[182])
else:
    if len(files) > 0:
        print("Warning: Not enough FITS files to use index 182. Using the first available map for initial display.")
        aia_map_initial = sunpy.map.Map(files[0])
    else:
        raise ValueError("No FITS files found to create an initial map. Check 'data_dir'.")

observer = aia_map_initial.observer_coordinate
if observer is None:
    raise ValueError("Observer coordinate missing. Verify data_dir file metadata.")
hpc_frame = Helioprojective(obstime=aia_map_initial.date, observer=observer)

bottom_left = SkyCoord(700 * u.arcsec, -300 * u.arcsec, frame=hpc_frame)
top_right = SkyCoord(1190 * u.arcsec, 200 * u.arcsec, frame=hpc_frame)

with SphericalScreen(observer):
    aia_map_initial = aia_map_initial.submap(bottom_left, top_right=top_right)

data_initial = aia_map_initial.data.copy()
data_initial[data_initial <= 0] = 1e-6
max_val_initial = np.percentile(data_initial[data_initial > 0], 99.5)
data_initial[data_initial > max_val_initial] = max_val_initial
aia_map_initial = sunpy.map.Map(data_initial, aia_map_initial.meta)

data_nonzero_initial = aia_map_initial.data[data_initial > 0]
vmin_initial = np.percentile(data_nonzero_initial, 1.5)
vmax_initial = np.percentile(data_nonzero_initial, 98)

if len(all_maps) <= 182:
    print(f"Warning: 'initial_map_index' (182) is out of bounds for the loaded maps ({len(all_maps)} maps). Setting to 0.")
    initial_plot_index = 0
else:
    initial_plot_index = 182

vmin = vmin_initial
vmax = vmax_initial

class Plotter:
    def __init__(self, all_maps, initial_map_index=0):
        self.maps = all_maps
        self.current_map_index = initial_map_index

        if not self.maps:
            raise ValueError("No SunPy Map objects provided to Plotter.")

        self.fig = plt.figure(figsize=(30, 30))
        gs = self.fig.add_gridspec(1, 2)

        self.ax1 = self.fig.add_subplot(gs[0, 0], projection=aia_map_initial.wcs)
        self.ax2 = self.fig.add_subplot(gs[0, 1])

        self.cut_points_pixel = []
        self.cut_lines = []
        self.stackplot_data = None
        self.cumulative_distances = None
        self.map_times = None
        self.upward_points = []
        self.downward_points = []
        self.fitted_lines = []
        self.upward_speed_kms = None
        self.downward_speed_kms = None
        self.speed_text_artists = []
        self.map_image = None

        self.slit_width_arcsec = 2.0
        self.boxcar_filter_size = None

        self.plot_initial_first_panel()
        self.plot_second_panel_placeholder()

        self.connect_events()

    def connect_events(self):
        self.cid_click = self.fig.canvas.mpl_connect('button_press_event', self.on_click)

    def on_click(self, event):
        if event.inaxes == self.ax1:
            self.on_click_first_panel(event)
        elif event.inaxes == self.ax2:
            self.on_click_second_panel(event)

    def on_click_first_panel(self, event):
        if event.button == 1:
            x_pixel, y_pixel = event.xdata, event.ydata
            if x_pixel is not None and y_pixel is not None:
                map_shape = self.maps[self.current_map_index].data.shape
                x_pixel = np.clip(x_pixel, 0, map_shape[1] - 1)
                y_pixel = np.clip(y_pixel, 0, map_shape[0] - 1)
                self.cut_points_pixel.append((x_pixel, y_pixel))
                print(f"Click {len(self.cut_points_pixel)}: ({x_pixel:.2f}, {y_pixel:.2f}) pixels")
                self.update_cut_line_and_points()
                if len(self.cut_points_pixel) == 16:
                    self.generate_and_plot_stackplot()
        elif event.button == 3:
            self.cut_points_pixel = []
            for artist in self.cut_lines:
                artist.remove()
            self.cut_lines = []
            for collection in self.ax1.collections:
                collection.remove()
            if self.map_image is None:
                self.plot_initial_first_panel()
            else:
                self.fig.canvas.draw_idle()
            print("Cut points cleared.")

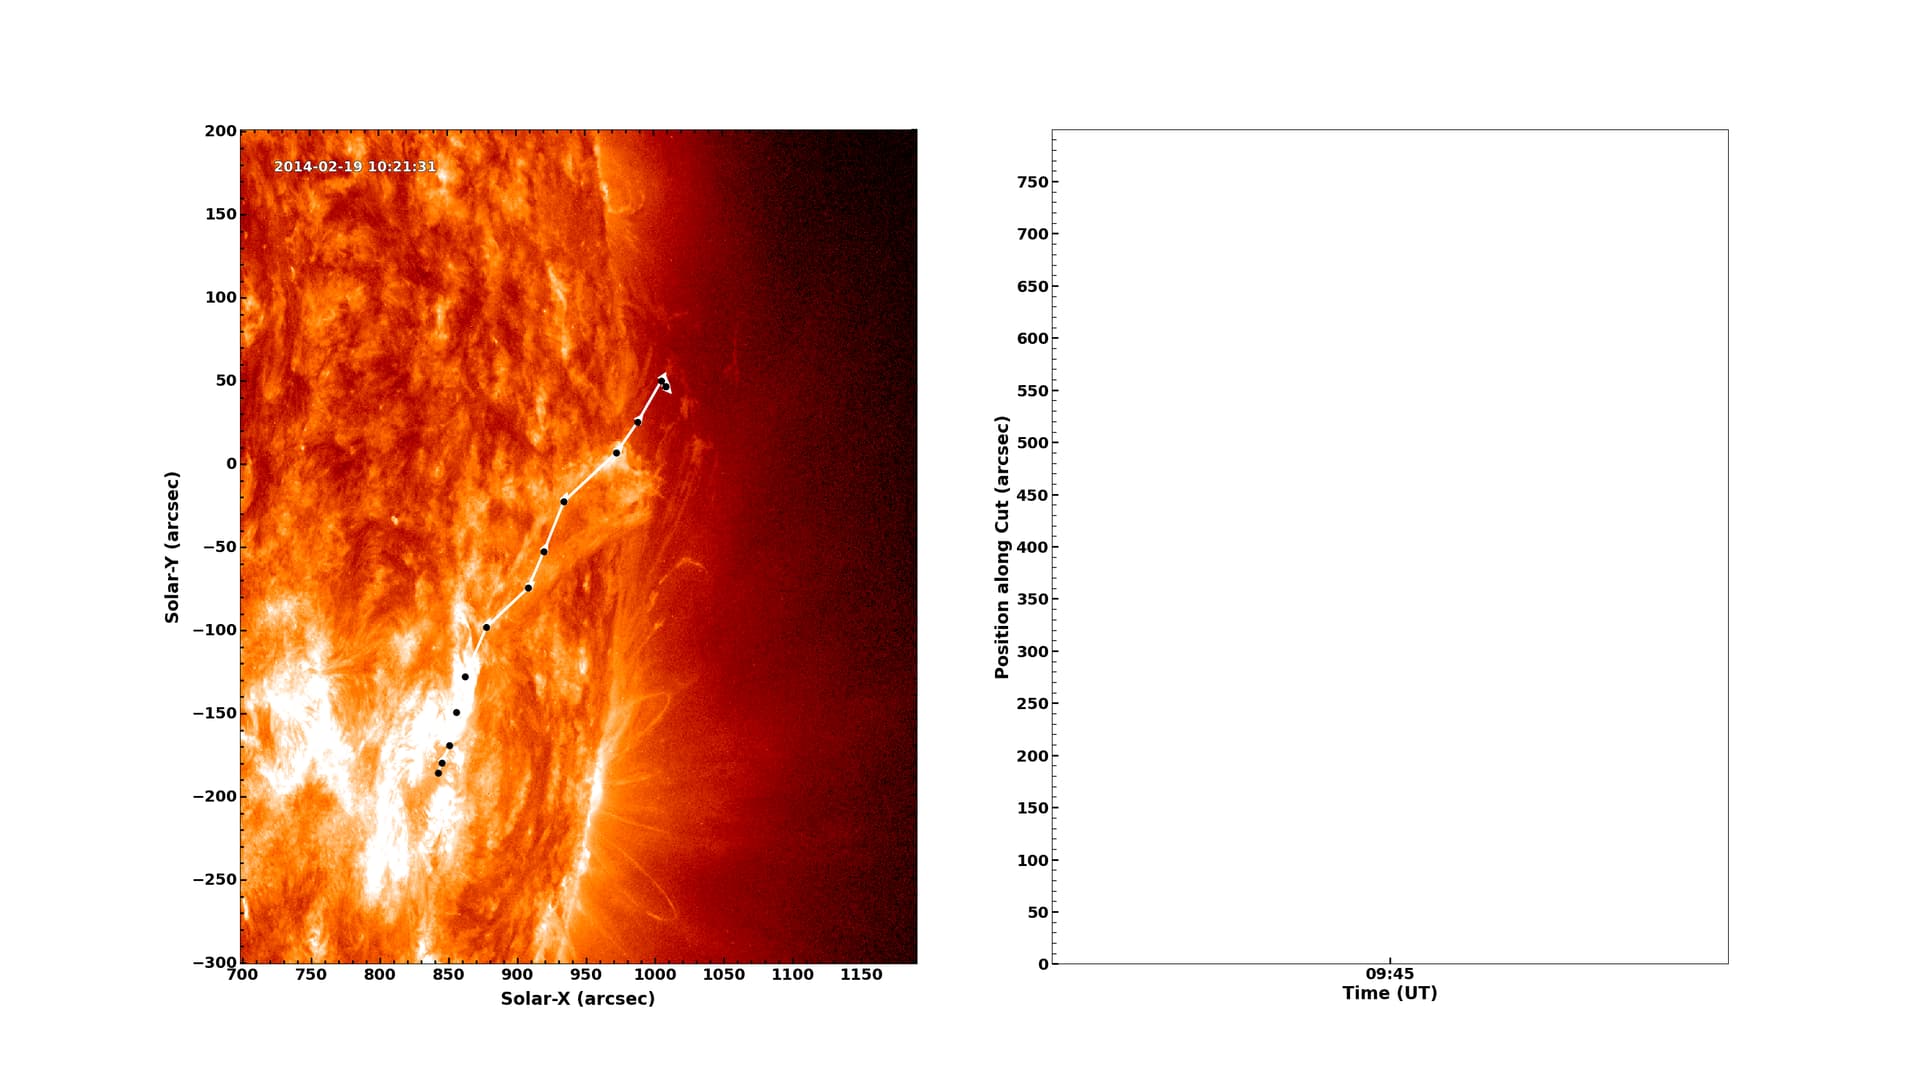
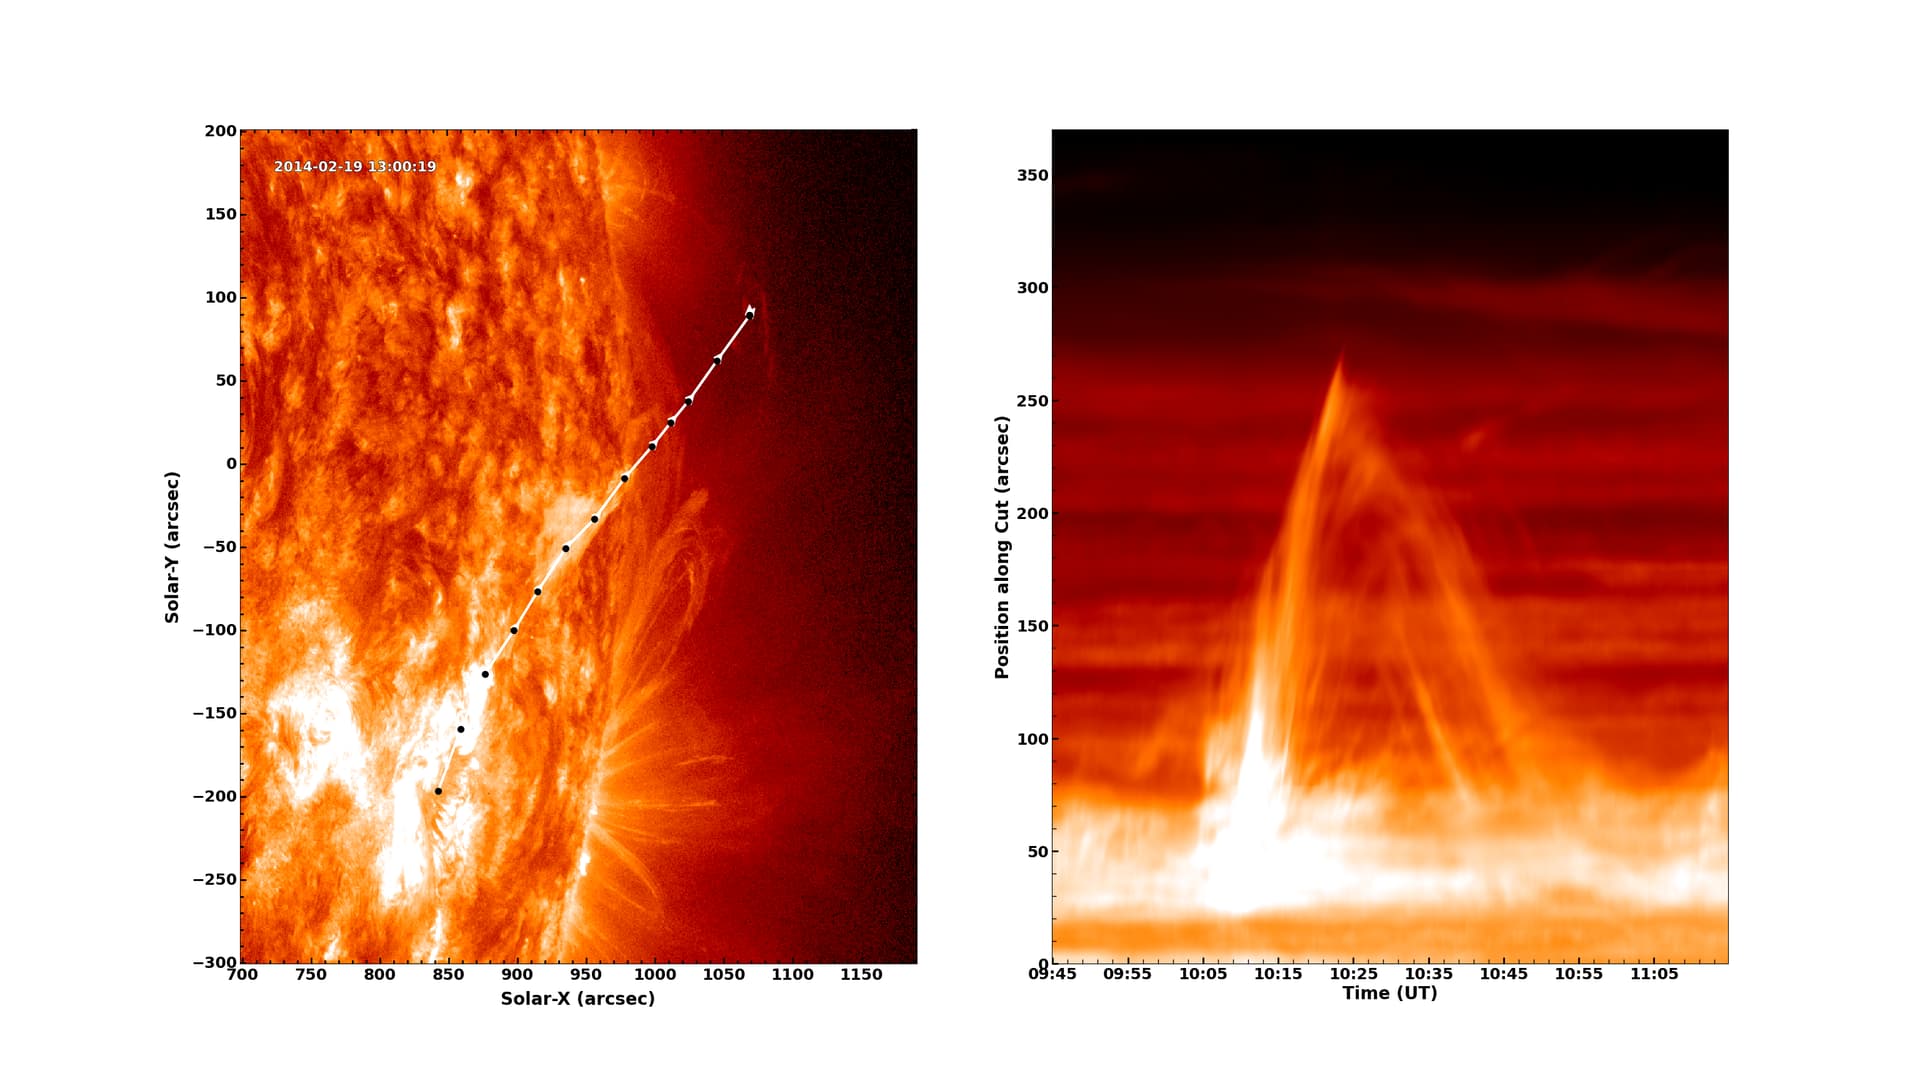
    def plot_initial_first_panel(self):
        current_map = aia_map_initial
        self.map_image = current_map.plot(axes=self.ax1, norm=LogNorm(vmin=vmin_initial, vmax=vmax_initial), cmap=cmap, title='')
        timestamp_for_display = current_map.date.strftime("%Y-%m-%d %H:%M:%S")
        self.ax1.text(0.05, 0.95, f"{timestamp_for_display}",
                      transform=self.ax1.transAxes, color='white', fontsize=16,
                      path_effects=[pe.withStroke(linewidth=1, foreground="black")],
                      zorder=12)
        self.ax1.grid(False)
        self.ax1.tick_params(axis='both', direction='in', width=1.6, length=7, labelsize=18, which='major', labelcolor='black')
        self.ax1.set_xlabel('Solar-X (arcsec)', fontsize=20, fontweight='bold')
        self.ax1.set_ylabel('Solar-Y (arcsec)', fontsize=20, fontweight='bold')
        if hasattr(self.ax1, 'coords'):
            self.ax1.coords[0].set_ticks(spacing=50 * u.arcsec)
            self.ax1.coords[0].set_format_unit(u.arcsec, decimal=True, show_decimal_unit=False)
            self.ax1.coords[1].set_ticks(spacing=50 * u.arcsec)
            self.ax1.coords[1].set_format_unit(u.arcsec, decimal=True, show_decimal_unit=False)
            self.ax1.coords[0].display_minor_ticks(True)
            self.ax1.coords[1].display_minor_ticks(True)
            self.ax1.coords[0].tick_params(which='minor', length=4)
            self.ax1.coords[1].tick_params(which='minor', length=4)
            self.ax1.coords[0].set_minor_frequency(5)
            self.ax1.coords[1].set_minor_frequency(5)
            self.ax1.coords[0].set_ticklabel(visible=True, weight='bold', color='black')
            self.ax1.coords[1].set_ticklabel(visible=True, weight='bold', color='black')
            self.ax1.coords[0].set_ticklabel(rotation=0)
            self.ax1.coords[1].set_ticklabel(rotation=0)
            self.ax1.axis('auto')
        else:
            print("Warning: ax1.coords not found. WCS specific settings might not be applied.")
        bottom_left_pix = current_map.pixel_to_world(0 * u.pix, 0 * u.pix)
        top_right_pix = current_map.pixel_to_world(current_map.data.shape[1] * u.pix, current_map.data.shape[0] * u.pix)
        print(f"WCS coordinate range: Bottom-left = ({bottom_left_pix.Tx.value:.1f}, {bottom_left_pix.Ty.value:.1f}) arcsec, "
              f"Top-right = ({top_right_pix.Tx.value:.1f}, {top_right_pix.Ty.value:.1f}) arcsec")
        self.fig.canvas.draw_idle()

    def update_cut_line_and_points(self):
        for artist in self.cut_lines:
            artist.remove()
        self.cut_lines = []
        for collection in self.ax1.collections:
            collection.remove()
        if len(self.cut_points_pixel) >= 2:
            for i in range(len(self.cut_points_pixel) - 1):
                start_pix_x, start_pix_y = self.cut_points_pixel[i]
                end_pix_x, end_pix_y = self.cut_points_pixel[i + 1]
                arrow = self.ax1.arrow(start_pix_x, start_pix_y,
                                       end_pix_x - start_pix_x, end_pix_y - start_pix_y,
                                       color='white', width=2, head_width=10, head_length=10, zorder=10)
                self.cut_lines.append(arrow)
        if self.cut_points_pixel:
            x_coords = [p[0] for p in self.cut_points_pixel]
            y_coords = [p[1] for p in self.cut_points_pixel]
            self.ax1.scatter(x_coords, y_coords, color='black', s=50, zorder=11)
        self.fig.canvas.draw_idle()

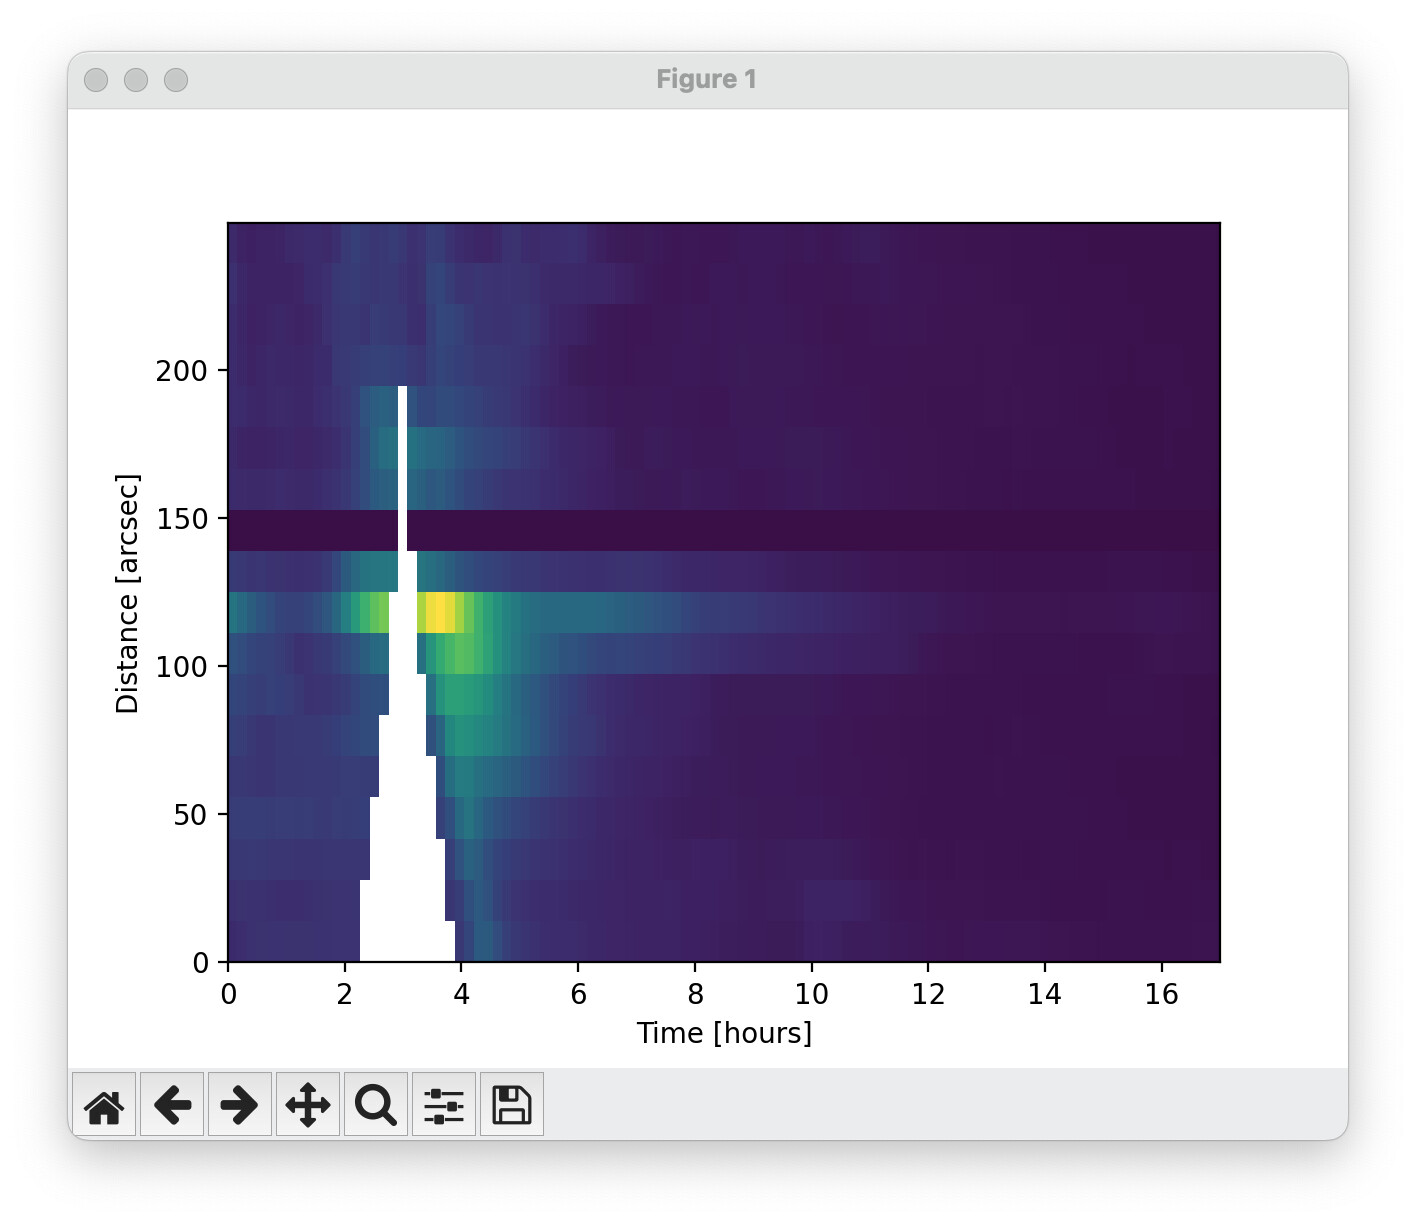
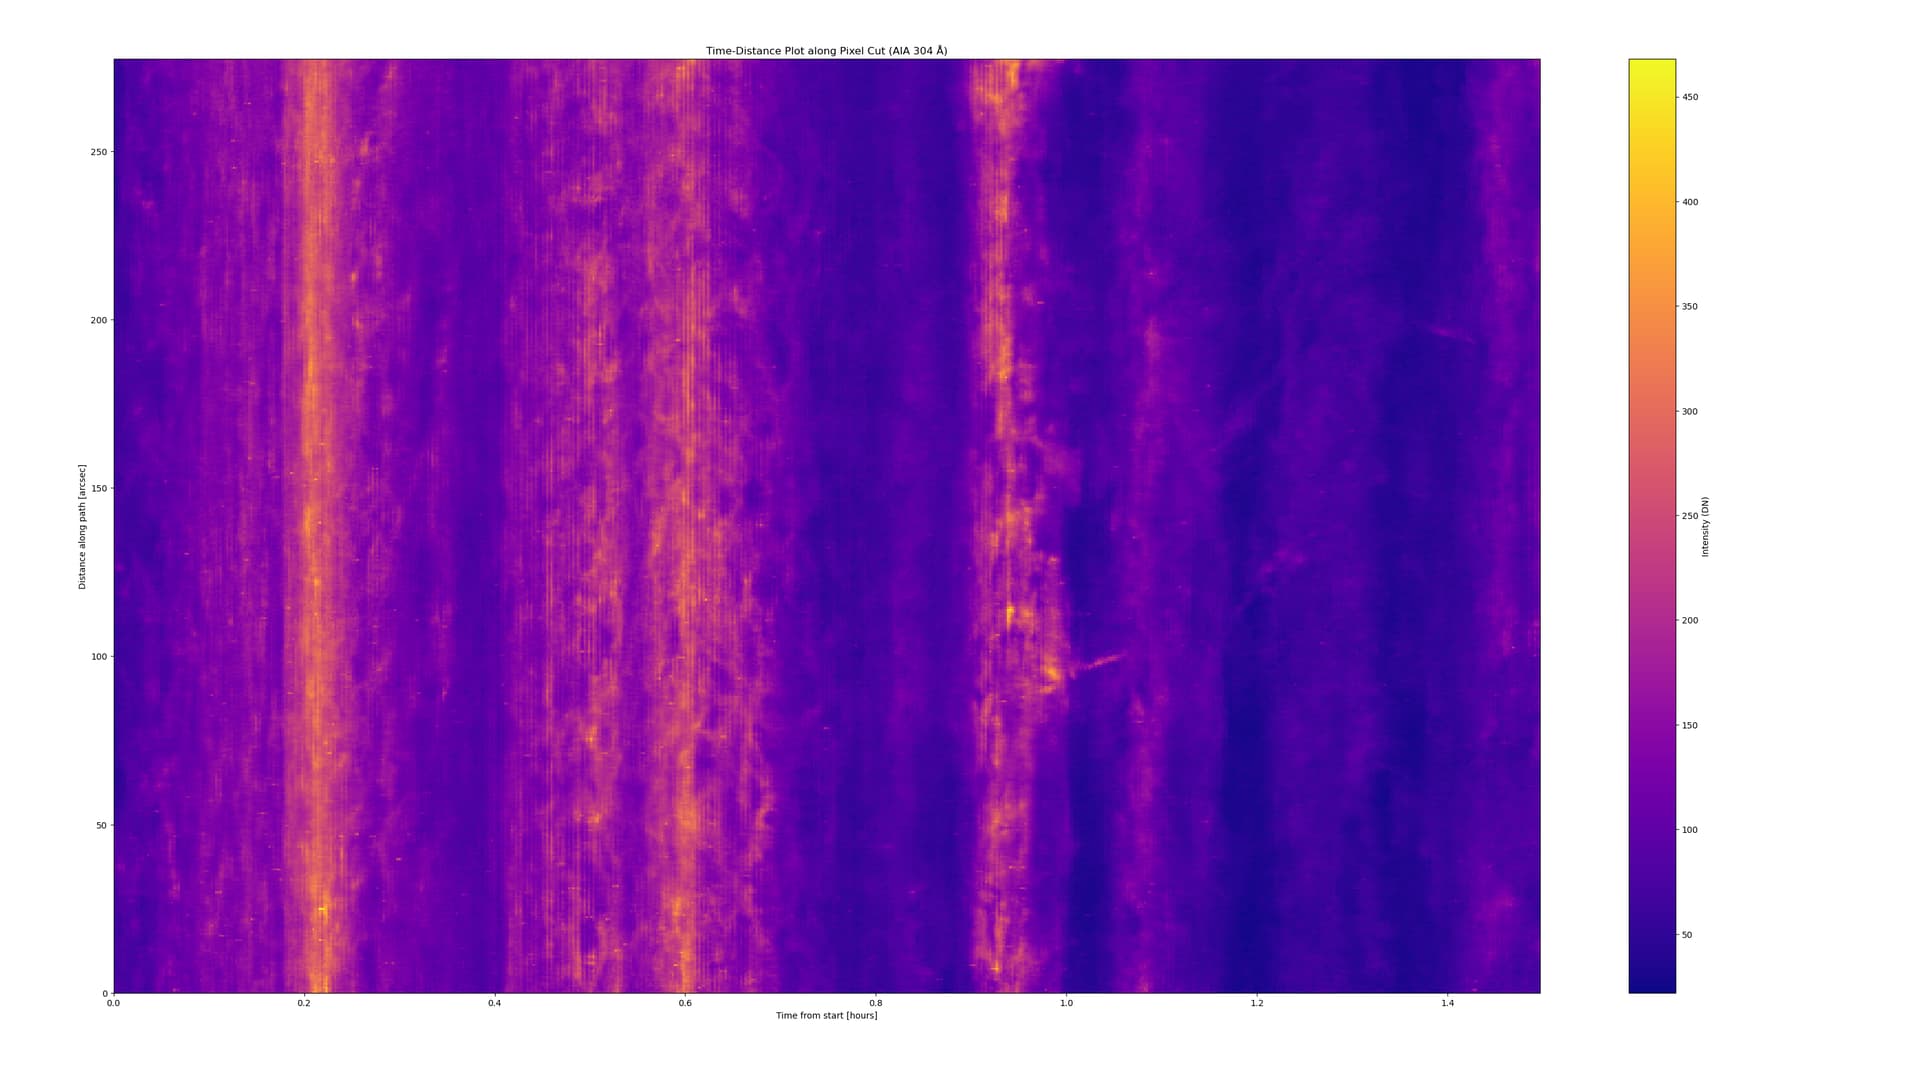
    def generate_and_plot_stackplot(self):
        if len(self.cut_points_pixel) < 2:
            print("Please select at least two points for the cut.")
            return
        print(f"Generating stackplot with slit_width_arcsec={self.slit_width_arcsec} "
              f"and boxcar_filter_size={self.boxcar_filter_size}...")
        print(f"Number of cut points: {len(self.cut_points_pixel)}")
        print(f"Number of maps: {len(self.maps)}")
        print(f"Slit points (pixels): {self.cut_points_pixel}")
        world_coords = self.maps[0].pixel_to_world(np.array([p[0] for p in self.cut_points_pixel]) * u.pixel,
                                                   np.array([p[1] for p in self.cut_points_pixel]) * u.pixel)
        print(f"Slit points (arcsec): {[(c.Tx.value, c.Ty.value) for c in world_coords]}")
        self.stackplot_data, self.cumulative_distances, self.map_times = \
            generate_time_distance_data(self.maps, self.cut_points_pixel,
                                        slit_width_arcsec=self.slit_width_arcsec,
                                        boxcar_filter_size=self.boxcar_filter_size)
        print(f"Stackplot data shape: {self.stackplot_data.shape if self.stackplot_data is not None else 'None'}")
        print(f"Stackplot data valid: {np.any(self.stackplot_data > 0) if self.stackplot_data is not None and self.stackplot_data.size > 0 else 'Empty or None'}")
        print(f"Cumulative distances: {self.cumulative_distances[:5] if self.cumulative_distances is not None else 'None'}")
        print(f"Map times: {self.map_times[:5] if self.map_times else 'None'}")
        if self.stackplot_data is not None and self.stackplot_data.size > 0:
            speeds_to_save = [self.upward_speed_kms if self.upward_speed_kms is not None else np.nan,
                              self.downward_speed_kms if self.downward_speed_kms is not None else np.nan]
            npz_data = {
                'timeslice': self.stackplot_data.astype(np.float32),
                'cut_x_pixel': np.array([p[0] for p in self.cut_points_pixel], dtype=np.float64),
                'cut_y_pixel': np.array([p[1] for p in self.cut_points_pixel], dtype=np.float64),
                'distance_along_slice': self.cumulative_distances.astype(np.float64),
                'map_times': np.array([t.isoformat() for t in self.map_times], dtype=str),
                'speeds': np.array(speeds_to_save, dtype=np.float32),
                'units': 'timeslice: intensity (DN), cut_x/y_pixel: pixels, distance_along_slice: arcsec (Euclidean), map_times: ISO format, speeds: [upward, downward] km/s',
                'description': f'AIA {wavelength} time-distance plot, generated {datetime.now().strftime("%Y-%m-%d %H:%M:%S")}'}
            try:
                np.savez_compressed(output_npz_file, **npz_data)
                print(f"Saved time-distance plot to {output_npz_file}")
            except Exception as e:
                print(f"Error saving .npz file: {e}")
        self.plot_second_panel()

    def plot_second_panel_placeholder(self):
        self.ax2.clear()
        self.ax2.set_xlabel("Time (UT)", fontsize=20, fontweight='bold')
        self.ax2.set_ylabel("Position along Cut (arcsec)", fontsize=20, fontweight='bold')
        self.ax2.text(0.5, 0.5, "No Stackplot Generated Yet",
                      horizontalalignment='center', verticalalignment='center',
                      transform=self.ax2.transAxes, fontsize=18, color='gray')
        self.ax2.tick_params(axis='x', which='major', labelsize=18, width=1.6, length=7, direction='in', labelcolor='black')
        self.ax2.tick_params(axis='y', which='major', labelsize=18, width=1.6, length=7, direction='in', labelcolor='black')
        self.ax2.tick_params(axis='both', which='minor', length=4, width=1, direction='in', colors='black')
        self.ax2.minorticks_on()
        self.fig.canvas.draw_idle()


def plot_second_panel(self):
        self.ax2.clear()
        if self.stackplot_data is None or self.stackplot_data.size == 0:
            print("Stackplot data is None or empty. Displaying placeholder.")
            self.plot_second_panel_placeholder()
            return
        start_time = self.map_times[0]
        time_deltas_seconds = np.array([(t - start_time).total_seconds() for t in self.map_times])
        distance_min = self.cumulative_distances[0]
        distance_max = self.cumulative_distances[-1]
        time_min = time_deltas_seconds[0]
        time_max = time_deltas_seconds[-1]
        dt_sec = (time_deltas_seconds[1] - time_deltas_seconds[0]) if len(time_deltas_seconds) > 1 else 0
        extent = [time_min - dt_sec/2, time_max + dt_sec/2, distance_min, distance_max]
        print(f"Plotting stackplot: extent={extent}, data shape={self.stackplot_data.shape}")
        im = self.ax2.imshow(self.stackplot_data, origin='lower', cmap=cmap, aspect='auto',
                             norm=LogNorm(vmin=np.percentile(self.stackplot_data[self.stackplot_data > 0], 2),
                                          vmax=np.percentile(self.stackplot_data[self.stackplot_data > 0], 98)),
                             extent=extent)
        self.ax2.set_xlabel("Time (UT)", fontsize=20, fontweight='bold')
        self.ax2.set_ylabel("Position along Cut (arcsec)", fontsize=20, fontweight='bold')
        def time_formatter_func(x, pos):
            absolute_time = start_time + timedelta(seconds=x)
            return absolute_time.strftime('%H:%M')
        self.ax2.xaxis.set_major_formatter(FuncFormatter(time_formatter_func))
        self.ax2.yaxis.set_major_locator(FixedLocator(np.arange(np.floor(distance_min/50)*50, np.ceil(distance_max/50)*50 + 1, 50)))
        self.ax2.tick_params(axis='x', rotation=0, labelsize=18, width=2, length=7, direction='in', labelcolor='black')
        self.ax2.tick_params(axis='y', labelsize=18, width=2, length=7, direction='in', labelcolor='black')
        self.ax2.tick_params(axis='y', which='minor', length=5, width=1, direction='in', colors='black')
        self.ax2.minorticks_on()
        major_tick_interval_seconds = 10 * 60
        all_seconds = np.array([(t - start_time).total_seconds() for t in self.map_times])
        if len(all_seconds) > 1:
            time_min_abs = all_seconds.min()
            time_max_abs = all_seconds.max()
            major_tick_locs = np.arange(np.floor(time_min_abs / major_tick_interval_seconds) * major_tick_interval_seconds,
                                        np.ceil(time_max_abs / major_tick_interval_seconds) * major_tick_interval_seconds + 1,
                                        major_tick_interval_seconds)
            self.ax2.set_xticks(major_tick_locs)
        self.ax2.xaxis.set_minor_locator(AutoMinorLocator(5))
        self.ax2.tick_params(axis='x', which='minor', length=5, width=1, direction='in', colors='black')
        self.ax2.set_xlim(time_min - dt_sec/2, time_max + dt_sec/2)
        self.ax2.set_ylim(distance_min, distance_max)
        self.ax2.axis('auto')
        if self.upward_points:
            sorted_indices = np.argsort([p[1] for p in self.upward_points])
            sorted_upward_points = [self.upward_points[i] for i in sorted_indices]
            upward_x_coords = np.array([p[0] for p in sorted_upward_points])
            upward_y_coords = np.array([p[1] for p in sorted_upward_points])
            self.ax2.plot(upward_x_coords, upward_y_coords, 'o', color='black', markersize=8, zorder=10)
        if self.downward_points:
            sorted_indices = np.argsort([p[1] for p in self.downward_points])
            sorted_downward_points = [self.downward_points[i] for i in sorted_indices]
            downward_x_coords = np.array([p[0] for p in sorted_downward_points])
            downward_y_coords = np.array([p[1] for p in sorted_downward_points])
            self.ax2.plot(downward_x_coords, downward_y_coords, 'o', color='black', markersize=8, zorder=10)
        for line in self.fitted_lines:
            self.ax2.add_line(line)
        self.speed_text_artists.clear()
        for text in self.ax2.texts[:]:
            try:
                text.remove()
            except Exception as e:
                print(f"Warning: Could not remove text artist: {e}")
        self.speed_text_artists = []
        for line, speed, label in zip(self.fitted_lines,
                                      [self.upward_speed_kms, self.downward_speed_kms],
                                      ['Upward Speed', 'Downward Speed']):
            if speed is not None and not np.isnan(speed):
                line_xdata = line.get_xdata()
                line_ydata = line.get_ydata()
                if len(line_xdata) > 1 and len(line_ydata) > 1:
                    mid_idx = len(line_xdata) // 2
                    mid_x = line_xdata[mid_idx]
                    mid_y = line_ydata[mid_idx]
                    dx = line_xdata[-1] - line_xdata[0]
                    dy = line_ydata[-1] - line_ydata[0]
                    angle = np.degrees(np.arctan2(dy, dx))
                    text_artist = self.ax2.text(
                        mid_x, mid_y + 15,
                        f"{label}: {speed:.2f} km/s",
                        color='white', fontsize=16, ha='center', va='center',
                        rotation=angle, rotation_mode='anchor',
                        path_effects=[pe.withStroke(linewidth=1, foreground="black")],
                        transform_rotates_text=True,
                        zorder=14
                    )
                    self.speed_text_artists.append(text_artist)
        self.ax2.set_title('')
        self.fig.canvas.draw_idle()

    def on_click_second_panel(self, event):
        if self.stackplot_data is None or self.cumulative_distances is None:
            print("Please generate the time-distance plot first by drawing a cut on the left panel.")
            return
        if event.button == 1:
            x, y = event.xdata, event.ydata
            if x is not None and y is not None:
                click_counter['count'] += 1
                print(f"Click {click_counter['count']} in second panel: Time (relative seconds): {x:.2f}, Position (arcsec): {y:.2f}")
                if click_counter['count'] <= 16:
                    self.upward_points.append((x, y))
                    print(f"Added point {len(self.upward_points)} to upward points")
                elif 16 < click_counter['count'] <= 32:
                    self.downward_points.append((x, y))
                    print(f"Added point {len(self.downward_points)} to downward points")
                if click_counter['count'] == 16 or click_counter['count'] == 32:
                    self.fit_and_display_eruption_speed()
                if click_counter['count'] == 32:
                    image_filename = f"combined_panel_{timestamp}_{uuid.uuid4().hex[:6]}.png"
                    fig2 = plt.figure(figsize=(20, 20))
                    ax2_new = fig2.add_subplot(111)
                    time_deltas_seconds = np.array([(t - self.map_times[0]).total_seconds() for t in self.map_times])
                    dt_sec = (time_deltas_seconds[1] - time_deltas_seconds[0]) if len(time_deltas_seconds) > 1 else 0
                    ax2_new.imshow(self.stackplot_data, origin='lower', cmap=cmap, aspect='auto',
                                   norm=LogNorm(vmin=np.percentile(self.stackplot_data[self.stackplot_data > 0], 2),
                                                vmax=np.percentile(self.stackplot_data[self.stackplot_data > 0], 98)),
                                   extent=[time_deltas_seconds[0] - dt_sec/2, time_deltas_seconds[-1] + dt_sec/2,
                                           self.cumulative_distances[0], self.cumulative_distances[-1]])
                    ax2_new.set_xlabel("Time (UT)", fontsize=20, fontweight='bold')
                    ax2_new.set_ylabel("Position along Cut (arcsec)", fontsize=20, fontweight='bold')
                    ax2_new.xaxis.set_major_formatter(FuncFormatter(lambda x, pos: (self.map_times[0] + timedelta(seconds=x)).strftime('%H:%M')))
                    ax2_new.yaxis.set_major_locator(FixedLocator(np.arange(np.floor(self.cumulative_distances[0]/50)*50,
                                                                           np.ceil(self.cumulative_distances[-1]/50)*50 + 1, 50)))
                    ax2_new.tick_params(axis='x', rotation=0, labelsize=18, width=2, length=7, direction='in', labelcolor='black')
                    ax2_new.tick_params(axis='y', labelsize=18, width=2, length=7, direction='in', labelcolor='black')
                    ax2_new.tick_params(axis='y', which='minor', length=5, width=1, direction='in', colors='black')
                    ax2_new.minorticks_on()
                    ax2_new.set_xticks(np.arange(np.floor(time_deltas_seconds.min() / (10*60)) * (10*60),
                                                 np.ceil(time_deltas_seconds.max() / (10*60)) * (10*60) + 1, 10*60))
                    ax2_new.xaxis.set_minor_locator(AutoMinorLocator(5))
                    ax2_new.tick_params(axis='x', which='minor', length=5, width=1, direction='in', colors='black')
                    ax2_new.set_xlim(time_deltas_seconds[0] - dt_sec/2, time_deltas_seconds[-1] + dt_sec/2)
                    ax2_new.set_ylim(self.cumulative_distances[0], self.cumulative_distances[-1])
                    if self.upward_points:
                        sorted_indices = np.argsort([p[1] for p in self.upward_points])
                        upward_x_coords = np.array([p[0] for p in [self.upward_points[i] for i in sorted_indices]])
                        upward_y_coords = np.array([p[1] for p in [self.upward_points[i] for i in sorted_indices]])
                        ax2_new.plot(upward_x_coords, upward_y_coords, 'o', color='black', markersize=8, zorder=10)
                    if self.downward_points:
                        sorted_indices = np.argsort([p[1] for p in self.downward_points])
                        downward_x_coords = np.array([p[0] for p in [self.downward_points[i] for i in sorted_indices]])
                        downward_y_coords = np.array([p[1] for p in [self.downward_points[i] for i in sorted_indices]])
                        ax2_new.plot(downward_x_coords, downward_y_coords, 'o', color='black', markersize=8, zorder=10)
                    for line in self.fitted_lines:
                        ax2_new.add_line(plt.Line2D(line.get_xdata(), line.get_ydata(), linestyle='--', color='white', linewidth=2, zorder=9))
                    for speed, label in zip([self.upward_speed_kms, self.downward_speed_kms], ['Upward Speed', 'Downward Speed']):
                        if speed is not None and not np.isnan(speed):
                            line_xdata = self.fitted_lines[0].get_xdata() if label == 'Upward Speed' else self.fitted_lines[1].get_xdata()
                            line_ydata = self.fitted_lines[0].get_ydata() if label == 'Upward Speed' else self.fitted_lines[1].get_ydata()
                            mid_idx = len(line_xdata) // 2
                            mid_x = line_xdata[mid_idx]
                            mid_y = line_ydata[mid_idx]
                            dx = line_xdata[-1] - line_xdata[0]
                            dy = line_ydata[-1] - line_ydata[0]
                            angle = np.degrees(np.arctan2(dy, dx))
                            ax2_new.text(mid_x, mid_y + 15, f"{label}: {speed:.2f} km/s",
                                         color='white', fontsize=16, ha='center', va='center',
                                         rotation=angle, rotation_mode='anchor',
                                         path_effects=[pe.withStroke(linewidth=1, foreground="black")],
                                         transform_rotates_text=True, zorder=14)
                    fig2.savefig(image_filename, dpi=300, bbox_inches='tight')
                    plt.close(fig2)
                    print(f"Saved second panel image as: {image_filename}")
                self.plot_second_panel()
        elif event.button == 3:
            self.upward_points = []
            self.downward_points = []
            self.fitted_lines = []
            self.upward_speed_kms = None
            self.downward_speed_kms = None
            self.speed_text_artists = []
            self.plot_second_panel()
            print("Upward and downward points, fitted lines, and speeds cleared.")
            click_counter['count'] = 0

    def fit_and_display_eruption_speed(self):
        for line in self.fitted_lines:
            try:
                line.remove()
            except Exception as e:
                print(f"Warning: Could not remove line artist: {e}")
        self.fitted_lines = []
        ARCSEC_TO_KM = 725.0
        if len(self.upward_points) == 16:
            sorted_indices = np.argsort([p[1] for p in self.upward_points])
            sorted_upward_points = [self.upward_points[i] for i in sorted_indices]
            x_data = np.array([p[0] for p in sorted_upward_points])
            y_data = np.array([p[1] for p in sorted_upward_points])
            print(f"DEBUG: Upward Fit Data - x: {x_data}, y: {y_data}")
            try:
                params, _ = curve_fit(linear_function, x_data, y_data)
                m = params[0]
                self.upward_speed_kms = m * ARCSEC_TO_KM
                fit_x = np.linspace(x_data.min(), x_data.max(), 100)
                fit_y = linear_function(fit_x, *params)
                self.fitted_lines.append(self.ax2.plot(fit_x, fit_y, '--', color='white', linewidth=2, zorder=9)[0])
                print(f"\n--- Upward Fit ---")
                print(f"  Fitted Speed: {m:.2f} arcsec/s ({self.upward_speed_kms:.2f} km/s)")
            except (RuntimeError, ValueError) as e:
                self.upward_speed_kms = np.nan
                print(f"Error fitting upward speed: {e}")
        if len(self.downward_points) == 16:
            sorted_indices = np.argsort([p[1] for p in self.downward_points])
            sorted_downward_points = [self.downward_points[i] for i in sorted_indices]
            x_data = np.array([p[0] for p in sorted_downward_points])
            y_data = np.array([p[1] for p in sorted_downward_points])
            print(f"DEBUG: Downward Fit Data - x: {x_data}, y: {y_data}")
            try:
                params, _ = curve_fit(linear_function, x_data, y_data)
                m = params[0]
                self.downward_speed_kms = abs(m) * ARCSEC_TO_KM
                fit_x = np.linspace(x_data.min(), x_data.max(), 100)
                fit_y = linear_function(fit_x, *params)
                self.fitted_lines.append(self.ax2.plot(fit_x, fit_y, '--', color='white', linewidth=2, zorder=9)[0])
                print(f"\n--- Downward Fit ---")
                print(f"  Fitted Speed: {abs(m):.2f} arcsec/s ({self.downward_speed_kms:.2f} km/s)")
            except (RuntimeError, ValueError) as e:
                self.downward_speed_kms = np.nan
                print(f"Error fitting downward speed: {e}")
        self.plot_second_panel()
        if self.stackplot_data is not None and self.stackplot_data.size > 0:
            npz_data = {
                'timeslice': self.stackplot_data.astype(np.float32),
                'cut_x_pixel': np.array([p[0] for p in self.cut_points_pixel], dtype=np.float64),
                'cut_y_pixel': np.array([p[1] for p in self.cut_points_pixel], dtype=np.float64),
                'distance_along_slice': self.cumulative_distances.astype(np.float64),
                'map_times': np.array([t.isoformat() for t in self.map_times], dtype=str),
                'speeds': np.array([self.upward_speed_kms if self.upward_speed_kms is not None else np.nan,
                                    self.downward_speed_kms if self.downward_speed_kms is not None else np.nan], dtype=np.float32),
                'units': 'timeslice: intensity (DN), cut_x/y_pixel: pixels, distance_along_slice: arcsec (Euclidean), map_times: ISO format, speeds: [upward, downward] km/s',
                'description': f'AIA {wavelength} time-distance plot, generated {datetime.now().strftime("%Y-%m-%d %H:%M:%S")}'}
            try:
                np.savez_compressed(output_npz_file, **npz_data)
                print(f"Updated .npz file with speeds: {output_npz_file}")
            except Exception as e:
                print(f"Error updating .npz file with speeds: {e}")

    def set_slit_width(self, width_arcsec=None):
        if width_arcsec is not None:
            self.slit_width_arcsec = float(width_arcsec)
            print(f"Slit width set to {self.slit_width_arcsec} arcseconds (half-width).")
        else:
            print("Please provide 'width_arcsec' for slit width.")
        if len(self.cut_points_pixel) >= 2:
            self.generate_and_plot_stackplot()

    def set_boxcar_filter(self, size):
        self.boxcar_filter_size = int(size) if size is not None and size > 0 else None
        print(f"Boxcar filter size set to {self.boxcar_filter_size}.")
        if len(self.cut_points_pixel) >= 2:
            self.generate_and_plot_stackplot()

if not all_maps:
    raise ValueError("No maps were loaded or generated. Cannot proceed with plotting.")
plot_app = Plotter(all_maps, initial_map_index=initial_plot_index)
plot_app.set_slit_width(width_arcsec=2.0)
plot_app.set_boxcar_filter(size=3)
plt.show()

my aim is to plot time-distance plot with aligned (re-projected data)

Hi there’s a lot going on there so it’s difficult to debug - maybe try removing everything that isn’t absolutely necessary and then add things back one at a time?

Also have you looked at this example Extracting intensity of a map along a line — sunpy 7.0.0 documentation it should make some of what you are attempting to do easier.

I’ve modified the above code to create a basic stack

import astropy.units as u
import matplotlib.pyplot as plt
import matplotlib.animation as animation

from astropy.coordinates import SkyCoord
from astropy.time import Time
from astropy.visualization import quantity_support, time_support
from sunpy.coordinates import SphericalScreen, propagate_with_solar_surface
from sunpy.map import Map, MapSequence, pixelate_coord_path, sample_at_coords

urls = [f'https://solmon.dias.ie/data/2025/07/15/AIA/fits/aia20250715_{i:02d}0000_0171.fits' for i in range(24)]

ref_map = Map(urls[0])

bottom_left = SkyCoord(700 * u.arcsec, -300 * u.arcsec, frame=ref_map.coordinate_frame)
top_right = SkyCoord(1190 * u.arcsec, 200 * u.arcsec, frame=ref_map.coordinate_frame)
ref_submap = ref_map.submap(bottom_left=bottom_left, top_right=top_right)

out_maps = [ref_submap]
times = [ref_submap.date]

for i in range(1, 23):
    with propagate_with_solar_surface(), SphericalScreen(ref_submap.observer_coordinate, only_off_disk=True):
        try:
            cur_map = Map(urls[i])
            times.append(cur_map.date)
            repro_map = cur_map.reproject_to(ref_submap.wcs)
            out_maps.append(repro_map)
        except:
            print(i, urls[i])

ms = MapSequence(out_maps)


# Make stack plot 
line_coords = SkyCoord([900, 1150], [0, 0], unit=(u.arcsec, u.arcsec),
                       frame=ref_submap.coordinate_frame)
intensity_coords = pixelate_coord_path(ref_submap, line_coords)

# Since alrady reproject only need to extract intensities
stack = [sample_at_coords(cmap, intensity_coords) for cmap in ms]

dist = intensity_coords[0].separation(intensity_coords)
time = Time(times)
time_diff = time - time[0]

plt.imshow(stack, extent=[time_diff[0].to_value('h'), time_diff[-1].to_value('h'),
                          dist[0].to_value('arcsec'), dist[-1].to_value('arcsec')],
                          aspect='auto')
plt.xlabel('Time [hours]')
plt.ylabel('Distance [arcsec]')

hiii, this works, but i am trying to click on the eruption and the slice will come after click just like IDL, in you program we have to put coordinates of the line, but i do not know the exact coordinates of the slit (line), that’s why i am preferring the click the method.

Can you refactor the example @samaloney gave you above into a function which your interactive plotter can call to generate the time-distance array based on the coordinates returned from the interactivity?

I tried refactoring the example provided by @samaloney into a function, but I’m still getting the same output as before. Could you kindly review the approach and let me know if I might be missing something.

my main aim is just to generate timedistance plot, after clicking because i do not have excat coordinates with aligned (re-projected data).

I would strongly suggest that you start by refactoring your code into separate functions that deal with specific functionally which can be called and verified independently of using the GUI.

People here are volunteers and do not have the time to debug over 2000 lines of Python code.

In this case, you just need to replace Shanes fixed points with your clicked points and that hopefully will be enough.

I’d echo what @nabobalis said if you break down the problem into smaller functions which you can verify work, or don’t work, as you expect it will be a lot easier to track the problem down and for us to help.

Have you tried printing print the coordinates you click on then modify the above code to use those points instead of the very simple coordinates I used?


Yes, I tried and got this result, i will follow this method to define small functions.

Is that what you wanted?

No, I want like this, i am giving line coordinates, now i am learning how to deal with aligned data. the above image is without reprojected data. i am doing somewhere wrong, i will try to resolve, otherwise i will again see @samaloney suggetion. Color is not a issue, atleast i got the trend. i am using this

import os
import glob
import numpy as np
import astropy.units as u
import matplotlib.pyplot as plt
from astropy.coordinates import SkyCoord
from astropy.time import Time
from astropy.visualization import quantity_support, time_support
from sunpy.coordinates import SphericalScreen, propagate_with_solar_surface
from sunpy.map import Map, MapSequence, pixelate_coord_path, sample_at_coords

quantity_support()
time_support()

data_dir = ''
wavelength = 304

cut_x_pixel = np.array([235.15356183, 507.93581989]) * u.pixel
cut_y_pixel = np.array([193.49934015, 566.47855493]) * u.pixel

files = sorted(glob.glob(os.path.join(data_dir, f'aia.lev1_euv_12s.*.{wavelength}.image.fits')))

if not files:
   print(f"No FITS files found in '{data_dir}' for wavelength {wavelength} with the specified pattern. Please check the directory and filename pattern.")
else:
   print(f"Found {len(files)} FITS files for wavelength {wavelength}. Processing for stack plot...")

   ref_map_index = 0 
   if ref_map_index >= len(files) or ref_map_index < 0:
       print(f"Error: Reference map index {ref_map_index} is out of bounds for the {len(files)} files found.")
       exit()

   try:
       ref_map = Map(files[ref_map_index])
   except Exception as e:
       print(f"Error loading the reference FITS file ({files[ref_map_index]}): {e}")
       exit()

   ref_submap = ref_map

   out_maps = [ref_submap]
   times = [ref_submap.date]

   for i in range(len(files)):
       if i == ref_map_index:
           continue
       try:
           cur_map = Map(files[i])
           with propagate_with_solar_surface(), SphericalScreen(ref_submap.observer_coordinate, only_off_disk=True):
               repro_map = cur_map.reproject_to(ref_submap.wcs)
               out_maps.append(repro_map)
               times.append(cur_map.date)
       except Exception as e:
           print(f"Warning: Could not process file {files[i]}. Error: {e}")

   if not out_maps:
       print("No maps were successfully processed to create the stack plot. Exiting.")
   else:
       ms = MapSequence(out_maps)
       times = Time(times) 
       start_coord = ref_submap.pixel_to_world(cut_x_pixel[0], cut_y_pixel[0])
       end_coord = ref_submap.pixel_to_world(cut_x_pixel[1], cut_y_pixel[1])
       
       line_coords = SkyCoord([start_coord.Tx, end_coord.Tx],
                              [start_coord.Ty, end_coord.Ty],
                              unit=(u.arcsec, u.arcsec),
                              frame=ref_submap.coordinate_frame)
       
       intensity_coords = pixelate_coord_path(ref_submap, line_coords)
       stack = [sample_at_coords(cmap, intensity_coords).value for cmap in ms]
       dist = intensity_coords[0].separation(intensity_coords)
       time_diff = times - times[0]

       # --- Plotting the stack plot ---
       plt.figure(figsize=(12, 7)) 
       plt.imshow(stack,
                  origin='lower', 
                  extent=[time_diff[0].to_value('hour'), time_diff[-1].to_value('hour'),
                          dist[0].to_value('arcsec'), dist[-1].to_value('arcsec')],
                  aspect='auto', 
                  cmap='plasma') 
       plt.colorbar(label='Intensity (DN)') 
       plt.xlabel('Time from start [hours]')
       plt.ylabel('Distance along path [arcsec]')
       plt.title(f'Time-Distance Plot along Pixel Cut (AIA {wavelength} Å)')
       plt.tight_layout() 
       plt.show()

Does that example work? What are your problems with it if not?

Yes, this example worked nicely. I have no problems with it